

Summarize this article with AI
Are you aware that you can monitor the progress of your live web applications? It will determine how well your customers will be treated. Nowadays, even though it’s pleasant, we frequently update and release our programs.
It usually results in performance or even functionality regression. You can monitor applications using Azure app insights using leveraged packages. We will walk into detail about its features and how it works.
The topics covered in this blog are:
- What is Azure Application Insights?
- How does Azure App Insights Work?
- What Azure Application Insights Monitors
- Azure Application Insights Features
- How to Create Azure Application Insights?
- How to Enable Application Insights for your Web App?
- How Do I Use Azure Application Insights?
- Azure Application Insights Pricing
- Conclusion
- FAQs
What is Azure Application Insights?
Developers and DevOps specialists can use Application Insights, an attribute of Azure Monitor, as an extensible Application Performance Management (APM) service.
You can use it to monitor your running programs. It will automatically detect performance anomalies and come with strong analytics capabilities to help you solve issues and understand how users actually use your app.

It is built in such a way to help you continuously increase performance and utility. It works for apps running on various solid platforms, including.NET, Node.js, Java, and Python, whether hosted on-premises, in a hybrid environment or in a public cloud.
It offers connection points to a variety of development tools and connects with your DevOps methodology. You can easily track and analyze measures from mobile apps through collective action with Visual Studio App Center.
How does Azure App Insights Work?
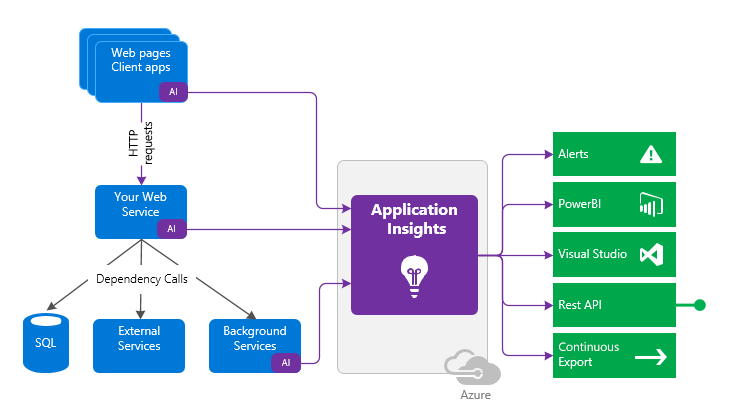
You can change Application Insights’ exploitation of the appliance Insights Agent when supported. You can also install an SDK in your application. The instrumentation tracks your app’s performance and sends the data to an Azure Application Insights resource using a unique GUID that we refer to as an instrumentation key.
The online service application and any background elements and JavaScript found within the sites can be instrumented. You can host the appliance and its components anywhere and won’t need Azure.
Also Check: Top 60+ Azure Interview Questions
What Azure Application Insights Monitors
- Azure App Insights report different exceptions depending on your servers and browsers.
- It provides you with information on requests and failure rates.
- The speed of response.
- It gives you access to your applications’ trace logs.
- Your browser’s functionality.
- Your sessions and users are counted.
- It also tells how your server machines use their networks, memory, and CPU.
- Exceptions – Examine the overall statistics, pick out particular cases, and delve deeper into the stack trace and related requests. There are rumours about each server and browser exception.
- Browsers used by your users can report page views and load performance.
- You can quickly get rates, delays, and failure rates for AJAX requests sent from web pages.
- Count of users and sessions.
- Host diagnostics coming from Azure or Docker.
- Your app’s diagnostic trace logs will allow you to connect trace events to requests.
- You create your own custom metrics and events within the client or server code to track commercial events like sales or wins.
Azure Application Insights Features
These are some of the best features for Azure App Insights:
1. Application Performance
Specific application performance statistics, such as response rates, exception rates, failure rates, and page-load durations, can be gathered by Application Insights.
Additionally, you may get host diagnostics data from the Azure platform, performance counters (CPU, memory, and network usage) from Windows/Linux servers, containerized workloads that aid in locating application bottlenecks, and data from Windows/Linux servers’ CPU, memory, and network consumption.
Application Insights aids in the capturing of errors involving both the server and the browser and offers deeper investigation through stack traces.
2. Application Usage
The detailed analytics provided by App Insights assist you in analyzing user interaction through data such as the most popular sites and peak access hours. It helps you better understand application usage is user and session count data.
Also, identifying underlying resource limitations will be assisted by correlating usage statistics with application performance measurements.
3. Custom Monitoring
You can create custom code and events to track particular application events using Application Insights in addition to the built-in metrics. You can monitor, for instance, the acceptance of a new product feature or the trends surrounding a specific product.
4. Application Availability
You can set up Application Insights to run ping tests or web requests to verify the availability of your applications. By using the SDK, you can combine any existing custom applications you may have for tracking availability with Application Insights. You can create Alerts and the unavailability of applications. You can also note any delays in application response time.
Check Out: Our blog post on Azure Certification Path 2023
How to Create Azure Application Insights?
Some of the requirements to use Azure App Insights are:
Prerequisites: You must have an Azure account or subscription. If you don’t have a Microsoft Azure account then check out this blog on how to create Microsoft Azure free account.
Let’s begin with the steps to establish Azure Application Insights.
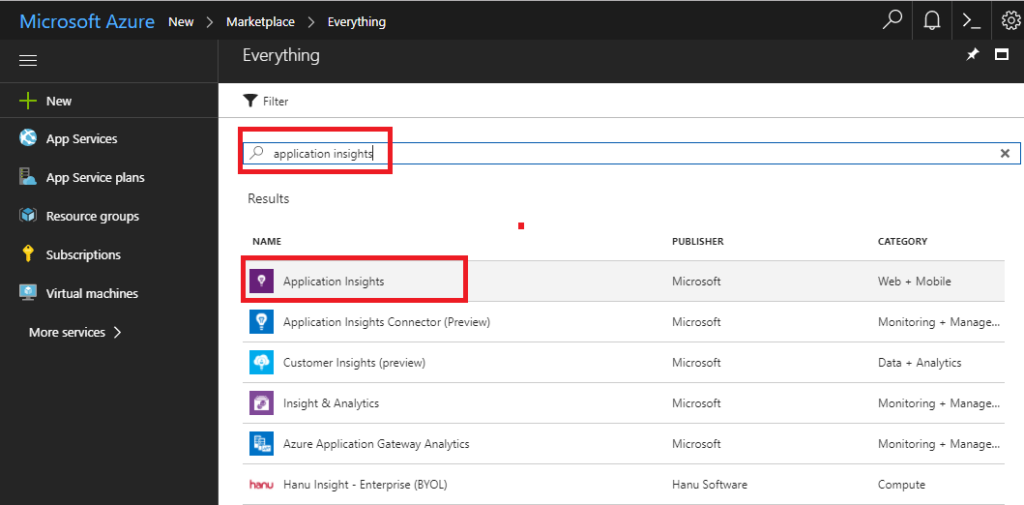
1. Open the Azure Portal and login.
2. Click the “Application Insights” search result after conducting a search for it.
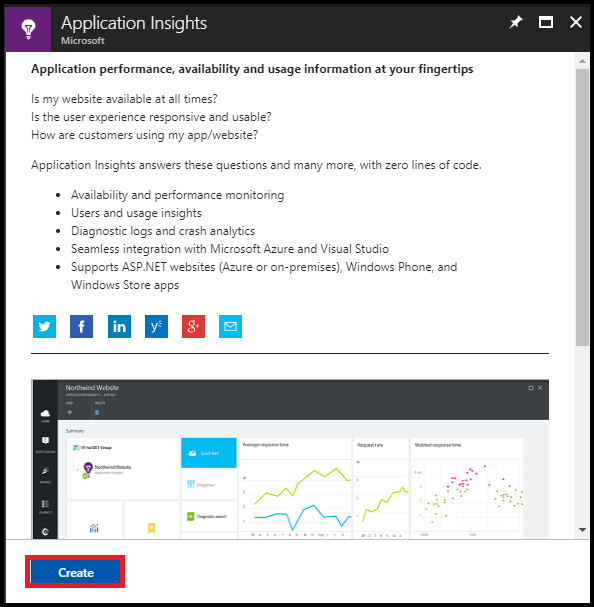
3. To create the Azure application Insights resource, click the + Create or Create Application Insights app buttons.
4. Give the information below in the Application Insights window.
- Subscription: A valid Azure subscription should be selected in order to construct the Application Insights.
- Resource Group: To create a new Resource Group, choose the Create a new link or an existing resource group from the list.
- Name: Give your Azure Insights a distinctive name.
- Region: Choose a region or a location.
- Resource Mode: Choose this option.
- Subscription: Choose a legitimate Azure subscription under Subscriptions.
- Log Analytics Workspace: Use the default workspace or pick one that is already set up.
Click the Review + Create button after that.

5. The next screen will now validate all the information you supplied and display the message “Validation Passed.” In order to construct the Azure Insight Analytics, click the Create button.
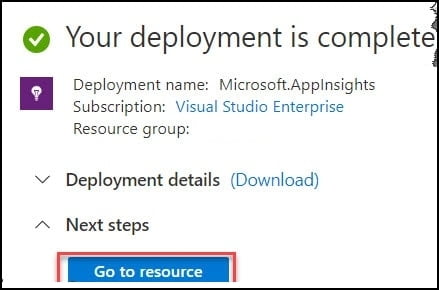
It will take a little while before it notifies you that your deployment is finished. To access the Azure Insight Analytics you’ve generated, click the Go to resource option.
How to Enable Application Insights for your Web App?
You should follow the instructions below to enable Application Insights for your web applications:
1. Navigate to the Overview tab in your Web App’s Azure Portal window.
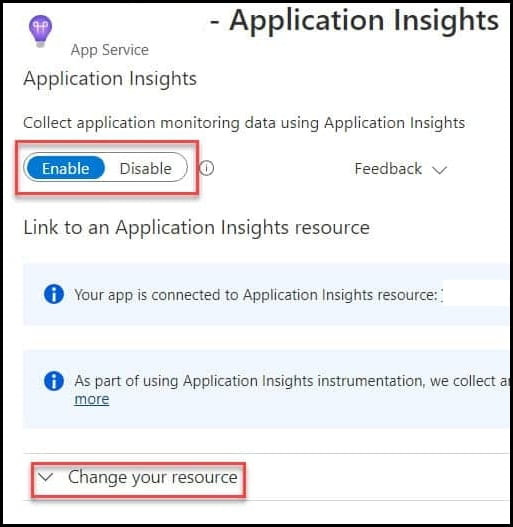
2. Select the below-highlighted Application Insights option. It might occasionally be turned on by default for you.

3. Alternatively if you can see the “Turn on Application Insights” button. To enable Application Insights for your WebApp, click that.
If you want to use App Insights to gather application monitoring data, you can select Enable. Expand the resource change option.
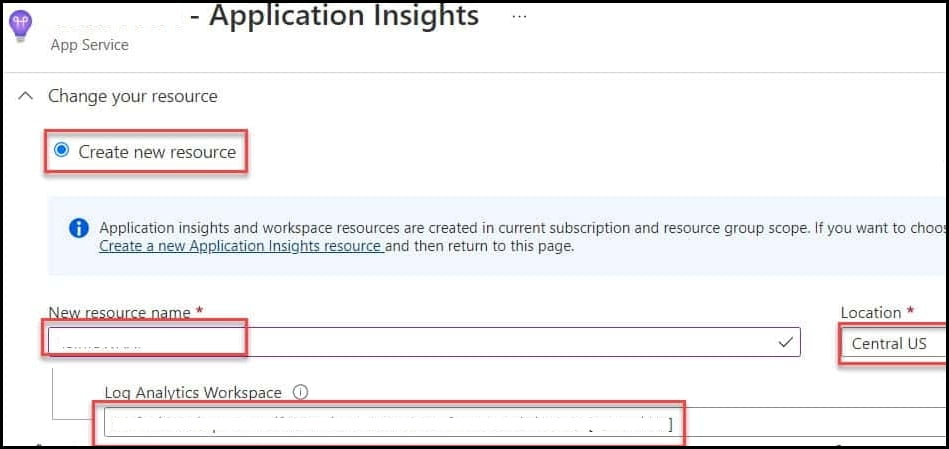
4. You can create a new Azure App Insights resource. Alternatively, one can pick an existing Application Insight resource.
Select the “Create a new resource” option to start a new resource.
- A New Resource: Give your resource a special name.
- Place: Pick a region or location.
- Log Analytics Workspace: You can either select the default workspace or the Log Analytics workspace.
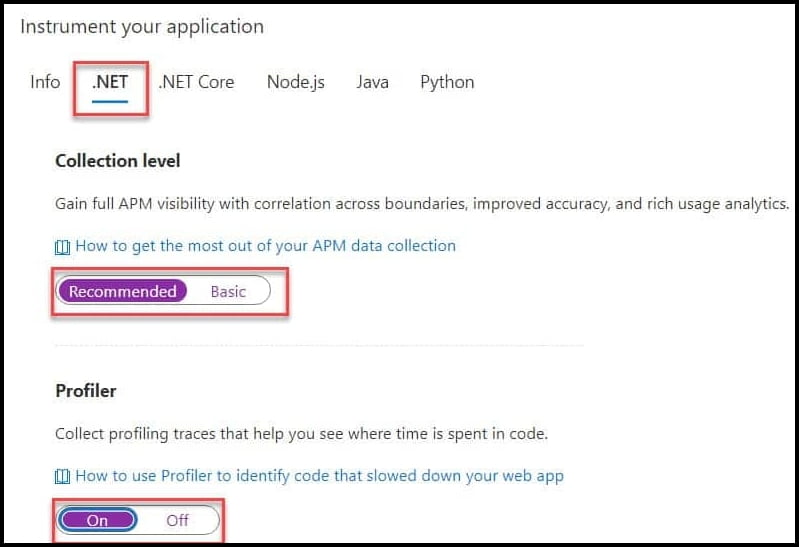
5. When you reach the Instrument, your application part, scroll down a little bit. Depending on the nature of your application and your needs, you can select among tabs like.Net,.Net Core, Node.js, Jave, Python, etc.
Based on our requirements and this demo perspective:
Then the combinations are as follows
- Collection Level: You should choose the option Recommend.
- Profiler: If you want to collect the Profiler traces, choose On.
- Snapshot Debugger: This option, which will assist you in gathering call stacks for your program when an exception is triggered, is advised to be selected as On. You can rapidly repair the exceptions with this method.
- SQL Statements: Based on your needs, turn it on or off.

6. To save the monitoring settings, click the Apply button, followed by the Yes button.
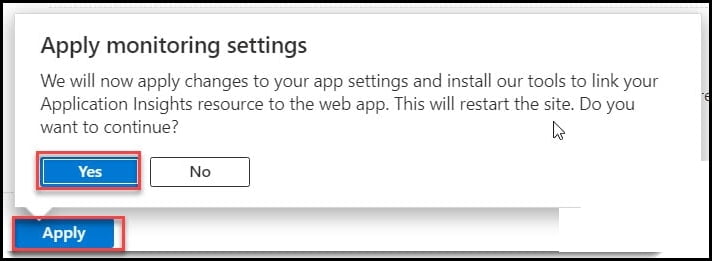
As you can see, the changes are complete, and the deployment was successful.
To view more information on the monitoring data, such as failed requests, server response time, server requests, availability, etc., navigate to the recently created Azure app insights.
Also Read: Azure Data Factory Interview Questions
How Do I Use Azure Application Insights?
Monitor
You can install Application insights in your app and:
- Check out the team space’s default application dashboard. It will help keep a watch on load, responsiveness, and the functionality of your dependencies, page loads, and mythical being calls.
- Find out which queries are the most unsuccessful and slow.
- Watch the live stream to learn about any degradation when you unleash a fresh unleash.
Discover, Diagnose
When you learn of an issue or receive an alert:
- Determine the proportion of users who are impacted.
- Make connections between failures, dependent calls, and traces.
- Analyze the trace logs, stack dumps, snapshots, and profiler.
Create, Measure, and Learn
- Analyze the impact of each new feature you introduce.
- Prepare for the use of new UX or business features by customers.
- Custom telemetry should be coded in.
- Base the following development cycle on demanding evidence from your telemetry.
Azure Application Insights Pricing
Price in relation to load
Load | Data Size | Pricing |
1000 requests a day | 1000 * 31 = 31,000 executions = 3.1 * 0.5 GB = ~1.55 GB | $1.26 |
10,000 requests a day | 10,000 * 31 = 31 * 0.5 GB = ~15.5 GB | $33 |
100,000 requests a day | 100,000 * 31 = 310 * 0.5 GB = 155 GB | $354 |
You should be careful while setting a daily volume cap. It will help you control the cost of Application Insights if your application generates a lot of data.
You can adjust the data limit by going to Application Insights -> Features and Pricing -> Daily Cap.
For further information about Azure Application insights pricing, check their website.
Conclusion
Azure Application Insights is a product from Azure Monitor that aids in this monitoring and uses built-in analytics capabilities to assist you in comprehending how your application is used and user interaction.
The service is compatible with several application development platforms, including .NET, Java, Python, and Node.js, hosted in both on-premises and various cloud settings.
Tell us in the comment section how much you like these Azure App Insights?
FAQs
Q1. What is Azure application Insights?
Azure Application Insights is an application performance monitoring and analytics service provided by Microsoft Azure. It helps developers monitor the health, performance, and usage of their applications by collecting telemetry data, such as requests, dependencies, exceptions, and custom events.
Q2. Is application Insights a PaaS service?
Yes, Azure Application Insights is a Platform as a Service (PaaS) offering. It is a fully managed service provided by Azure, relieving users from the burden of infrastructure management. Application Insights seamlessly integrates with various Azure services and development tools.
Q3. What are the types of application insights?
The types of Application Insights available include web applications, mobile applications, and ASP.NET Core applications. These types provide specific instrumentation and analytics capabilities tailored to the respective application types.
Q4. Where is application Insights data stored?
Application Insights data is stored in the Azure region associated with the Application Insights resource. The telemetry data, such as metrics, traces, and exceptions, are collected and stored in Azure Storage and processed by the Application Insights service.
Q5. What is the limit of application Insights?
The limit of Application Insights depends on the pricing tier and the selected quota. In the free tier, there are limitations on data retention and data volume. Paid tiers offer increased data retention periods, higher data ingestion rates, and additional features such as Live Metrics Stream and Azure Monitor integration.
Related/References
- Azure App Service: Types, Benefits and Overview
- Azure Event Grid: Features, Architecture & How it Works
- Azure Landing Zone: Architecture, Benefits & How to Setup
- AWS vs Azure vs Google Cloud – Detailed Comparison in 2022
- Azure Storage Account: A Comprehensive Guide for Beginners
- Azure Rights Management: Features, Why & How it Works
- Application Insights overview – MS Doc